Janine Randerson with;
- sound composer: Jason Johnston
- and advisor: Roger Dennis (Sensing Cities)
http://neighbourhoodhope.wordpress.com/
Workshop Tour provocation & Images || Christchurch || Dunedin || Wellington || Auckland
‘Neighbourhood Hope Index’ uses clouds and sound to map affective zones in post-earthquake Christchurch. The framework for this artwork stems from the emergent currency of data in the plan for a better city. A so-called silver lining for the embattled inhabitants is that a ‘smart’ city may emerge where the instrumental measurement of traffic flows, water quality, air quality and urban weather can be remedied. The project considers atmosphere/air in bio-physical terms as well as in social terms, recognisable in the phrase ‘an air of calm’ for example. Rather than using national or global data, this online platform measures and maps the qualitative value of ‘hope’ in specific suburbs in Christchurch.
Alternative forms of economic indices exist in the form of the ‘Happiness index’ that take into account our quality of life. Climate, air quality and ecologies of human and city as a shared entity are part of this, usually viewable in map or table form. For example the ‘Happy Planet Index’ measures life expectancy, well-being and ecological footprint, while the ‘Gross National Happiness Index’ in Bhutan provides an overview of performance across 9 domains (psychological wellbeing, time use, community vitality, cultural diversity, ecological resilience, living standard, health, education, good governance.)[1]
Post-earthquake rhetoric in Christchurch often reveals the desire that Voltaire expressed, (while reflecting on the Lisbon earthquake of 1755); ‘A civilization worthy of its name should pay special heed to disasters, learn from the mistakes they revealed, and harness intelligence, science and sympathy to make a better world.’ [2] There is the hope that such catastrophes might present extraordinary opportunities to make improvements in ecological relations between city dwellers and their environment. Historically the airshed above Christchurch has been regularly monitored for the often toxic levels of PM10 by the Ministry of the Environment; can this be rectified in the new, more energy and data efficient city? And the people themselves; how can a more community-orientated social atmosphere be fostered? This online work takes into account both weather, temperature and humidity and the affective climate of the city where airspace is as contestable as the ground.
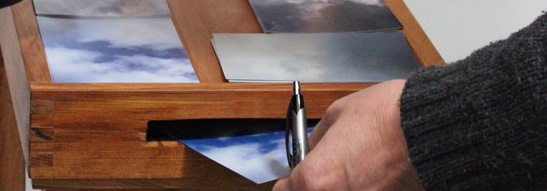
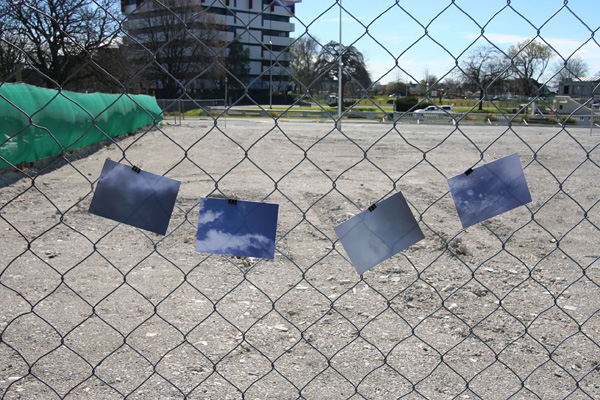
Contemporary State maps usually provide economic data as they divide land for territory. The colonist William Wakefield conceived Christchurch in terms of grids yet earlier Waitaha, Ngati Mamoe, and eventually Ngai Tahu inhabitants navigated the wetland for food-gathering by the rivers and the geological features, stars and divine portents. As an alternative system, different coloured clouds in the ‘Neighbourhood Hope Index’ above the city represent different affective atmospheres from the disgruntled to cautiously optimistic.
participation
There is both an online and on-site dimension to this work. Participants can indicate the current mood in the area in the city that they inhabit in an online interface. The data will change based on weather conditions, such as temperature and humidity. If possible the project will be expanded to include air quality information. One way to add mood amplifying or shrinking processes the clouds is to move up and down a gradated scale based on cloud density or colour.

Working drawing for ‘Neighbourhood Hope Index’[The silver lining]
[1] The Happy Planet Index. (n.d) [http://www.happyplanetindex.org/data/#sthash.dX4P6ZnJ], accessed 25 June 2013.
The Gross National Happiness Index. (n.d) [http://www.grossnationalhappiness.com, accessed 25 June 2013.
[2] Dr Su Ballard drew attention to this quote from Voltaire cited in an essay by Kevin Rosario (‘Rising from the Ruins’,Wall Street Journal, 16.1.2010) in her recent roundtable discussion at ISEA, Sydney, 2013. Rosario also notes that in New Orleans, after Katrina that industrial production, carbon dioxide emissions and the increased ferocity of hurricanes led to the conclusion that industrial development was not the post-earthquake solution, the positive outcome, but the problem. Poorer neighbourhoods are also more deeply effected by disaster.
Timeline:
Janine visited Christchurch to speak on the topic of ‘Neighbourhood Air’ (2012) and ‘Neighbourhood Hope Index’ (2013) as the touring artist for 2013 (Mesh Cities) accompanied by Roger Dennis of the Sensing Cities project at the Physics room in September 12th as part of the ADA Mesh Cities project.
Janine held a workshop with participants for ‘Neighbourhood Hope Index’ in September at the same time as the talk. This workshop would provide me with the material to work up the data to have a functioning cloud map of affective states by November 2013.


Space: Network: Memory ADA symposium in Dunedin:
Janine’s ‘Neighbourhood Hope Index’ was one of the Saturday workshops in the 3 day event, her stand was set up adjacent to the room where most of the events of Symposium took place.


